
Self driving cars. The imminent future of on-demand and super cheap transportation - or still a long development slog ahead, depending on who you listen to. Earlier this year, California released the 2016 Autonomous Vehicle Disengagement Reports - which are reports of times that the human driver had to take over from the computers (either because the computers handed off control, or because the human wasn’t comfortable with what the computer was doing).

When the reports came out, quite a few sites covered them - at the year granularity. They just did some quick aggregation of the numbers for a whole year, perhaps made a graph, and (as is common in the media today) published a quick article about it.
I haven’t seen anyone delving deeply into the data by using the month-by-month numbers - which are provided. So, I did. And some very interesting trends showed up for a few companies!
Interested in how everyone did in the month-by-month data? Read on!
2016 Analysis and Limitations
I’m limited in my analysis to what the reports state (so, California, for Dec 2015 through Nov 2016). Some are very detailed (Waymo’s), some are sparse (most of the others, though the Mercedes one pager takes the “brevity” award).
I’ve decided to report the disengagement numbers in “Disengagements per 1000 miles,” because that avoids very small numbers from a particular company, and because that works out reasonably close to one month of driving at the US average annual miles of 13,476 (as of July 2016) - so think of the ratio as “Disconnects per month,” if you prefer.
I’m only reporting data from companies that actually reported driving miles on public roads. Honda and Volkswagen both submitted reports, but don’t do any testing on public California roads.
What Qualifies as a Disengagement?
From 13 CCR § 227.46(a) (emphasis mine):
For the purposes of this section, “disengagement” means a deactivation of the autonomous mode when a failure of the autonomous technology is detected or when the safe operation of the vehicle requires that the autonomous vehicle test driver disengage the autonomous mode and take immediate manual control of the vehicle.
I’m going to be pessimistic here with the reported numbers and assume that everything reported is a countable disengagement. Some companies have pretty creative naming of their disconnects. I simply don’t believe something like “Planned test, to avoid unexpected behavior” (in the report) means that it was actually planned. Except, perhaps, in the second or so before. Several companies are really bad about this, and if it really was an expected end-of-test disconnect, they wouldn’t have reported it in the first place.
Graphs and Data
For each report, I gathered the data by month (combining multiple vehicles if needed), and graphed the results.
I have one graph for total miles driven each month, one graph for total disconnects each month, and one graph showing the disconnects per 1000 miles driven - which is the most interesting graph, as this shows how well the automation is handling the actual task of driving. This graph also gives a decent idea as to the improvement over the year.
I also include the aggregate annual numbers for each company at the top of each section. In some cases, those reflect the company well, but in other cases, the company was making radical improvements throughout 2016, so the aggregate numbers don’t tell the whole story.
In any case, on to the reports!
BMW Group
Autonomous miles: 638
Disengagements: 1
Disengagements per 1000 miles: 1.57


BMW only had one unplanned disengagement (related to lane markers not being clear enough on a clear and dry day). This was on Highway 101. Their report is quite basic, with very little to extract from it other than the raw numbers. The main takeaway is that while BMW tests in California, they don’t do much testing. They do seem to be pretty good at highway driving!
Bosch
Report (3 pages, original and amended report present)
Autonomous miles: 983
Disengagements: 1442
Disengagements per 1000 miles: 1467


Bosch offers a decently detailed report in terms of driving situations and causes for disconnection. Most of their driving was in the “interstate” category, with some driving on “highways.” There were 2 disconnections on “public rural roads or other streets,” implying that they aren’t restricting themselves to purely controlled access roads. However, bulk of the disconnects being on highways or interstates implies that most of their testing is on those roads.
According the the report, all 1442 of their disconnects were caused by “planned test of technology.” Really? Tell me more about these “planned tests…”
The main takeaway is that the Bosch systems can’t get much beyond a mile, in ideal conditions. It looks like there may be some weather sensitivity here as well - late winter conditions have a lot of disconnects per mile, and November had a big spike as well.
I can’t say I’d be betting on the Bosch system any time soon.
GM Cruise
Autonomous miles: 9771.8
Disengagements: 181
Disengagements per 1000 miles: 18.5


First, I want to address the report wording: Literally every disconnect is a “Planned test, to…” - reasons include “to address hardware,” “to address planning,” “to avoid unexpected behavior.” And these are reportable disconnects. So, yet again, I’m not inclined to believe that every one of these was a “planned test” - and I count each and every reported disconnect here.
Now. That said. WOW. This is what continuous improvement looks like! The miles per month ramp up from very low to over 1000 miles a month, and the disconnects per 1000 miles drop from rather high to around 2.5 by the end of the test period - the total disconnects per 1000 miles over the year absolutely misses how GM Cruise improved during 2016. This is a properly impressive bit of performance - by the end of the year, they’re second to Waymo in disconnect ratio!
Delphi
Autonomous miles: 3090
Disengagements: 178
Disengagements per 1000 miles: 57.6


This report has a pretty nice amount of detail in disconnect reasons - cyclists, traffic lights, pedestrians, emergency vehicles, etc. It gives a better feel for the issues they’re dealing with - and while every location is “Street,” many of the issues do imply that they’re working on city streets. Cyclists generally aren’t a problem on the highway. So, while the disconnects per mile seems a bit higher than some other companies, if this is in city traffic, it looks pretty good!
It stands out here more than in some other graphs, but July was a rough month for self driving cars. For some reason, most companies that ran all year had a higher disconnect ratio in July than the surrounding months. Maybe the sun interfered with sensors? I haven’t figured out any specific reasoning for it.
Ford
Report (3 pages)
Autonomous miles: 590
Disengagements: 3
Disengagements per 1000 miles: 5.1


I assume Ford has a test fleet somewhere else and was working on California for some reason in March. They put on a good number of miles with a low disconnect rate of just above 5 per 1000 miles (so 200 miles per disconnect), but this is all they reported for California in 2016.
They’re certainly worth keeping an eye on, though.
Nissan
Autonomous miles: 4099
Disengagements: 28
Disengagements per 1000 miles: 6.83


Nissan has an excellent report with good data - and they’re also very clearly testing on city streets based on the reported locations and conditions of the disconnects! Unlike a lot of the other reports, the Nissan disconnect report goes into detail about the nature of the disengagements.
However, the only disconnects mentioned are during dry weather, and mostly during sunny conditions - I’m not sure if they’re doing all weather testing yet or just nice day testing.
Their disconnect numbers are pretty good, though. If that’s for all conditions, including city driving, they clearly have something that understands a lot.
Mercedes Benz
Autonomous miles: 673.45
Disengagements: 336
Disengagements per 1000 miles: 498.9


Mercedes is another case where the aggregate data just doesn’t tell the full story - the monthly data shows the significant improvement over the year. The report sucks - there’s just the basic numbers with no additional detail. But those numbers tell an interesting story.
The first few months of testing (Feb, March, April) were awful. There’s no other way to put it. Over 4000 disconnects per mile - that means that they couldn’t go a quarter mile without a problem. The numbers got better in March and April, but they still couldn’t even make it a mile.
Then, there were four months of no testing - and when they started driving again, the disconnect rate was radically, radically better - and the miles driven show a very strong upward trend. Clearly, Mercedes took some time to figure out a different way of doing things, and that new method works a lot better than the old method. It’s still not that great (a couple hundred disconnects per thousand miles), but the improvement trend is clear.
Tesla
Autonomous miles: 550
Disengagements: 182
Disengagements per 1000 miles: 330.9


So… here’s the Tesla data. They are, by far, the loudest company about self driving cars. And I have no idea what they’re going on about, given the complete lack of competent self driving in California.
There is less than a week’s worth of self driving days represented in the report (Oct 14, 15, 16, 17, 22, plus a few miles in Nov) - and nothing particularly impressive, in terms of disengagement rate.
What were they doing? Well, evidence would seem to indicate that they were trying to either find a route or record a take for their self driving video (from Nov 18) that the car could actually drive unassisted. Beyond that? Not much.
The Daily Kanban goes much deeper into this video, the disengagement reports, and eyewitness reports from people who saw the filming - it seems like Tesla needed about 550 miles of driving to get a 3.3 mile video. I can’t say I’m particularly impressed. Especially because there’s…
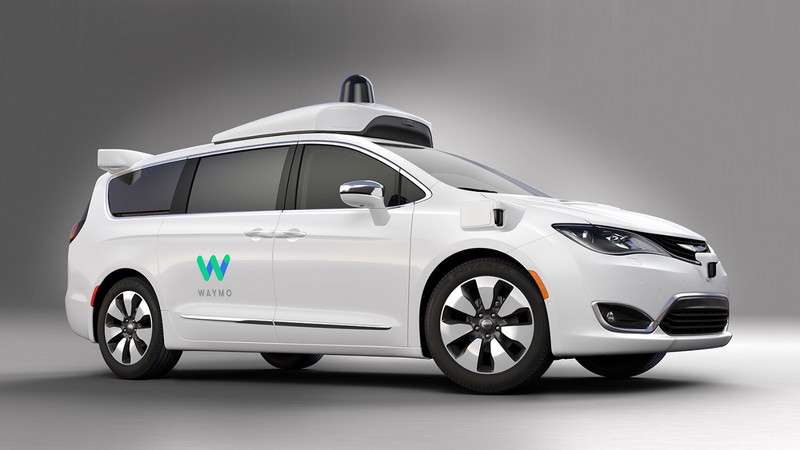
Waymo
Report (34 pages total, 17 pages plus amended report)
Autonomous miles: 635867.7
Disengagements: 124
Disengagements per 1000 miles: 0.195
No, really. Read those numbers again. Six hundred thirty five thousand, eight hundred sixty seven miles. With less than 0.2 disconnects per 1000 miles - that means over 5000 miles, average, between disconnects.


Wow.
There’s Waymo, and there’s everyone else. They’re not even playing the same game.
The report is solid, if a bit vague on disengagement details. They explain what the metrics are much better than any other report - this is the only report that comes with the background information needed to properly understand it.
And then there’s the system performance. They are, far and away, the leaders here. They’re putting hundreds of thousands of miles a year on the cars (the report notes that in 2015, they put a mere 424,321 miles on, with a disengagement rate per 1000 miles of 0.80) and performing radically better than everyone else.
Apparently, lidar is a useful thing to have on a self driving car!
At least based on the disengagement ratio, Waymo is far, far closer to a production-ready system than anyone else.
Summary Charts
The summary charts for the year demonstrate, rather clearly, just how radically far ahead Waymo is, in terms of miles driven and disconnect performance - but also, presumably, in data collection about the types of weird things that actually happen on the road. Things like cyclists doing track stands at stop lights (the slight movements of the cyclist doing a track stand baffled the poor self driving car quite completely, and they danced for two whole minutes like that).

If one removes Waymo, the other companies come into a useful focus - and GM Cruise is leading everyone else by a factor of two and change. That, combined with the consistently improving performance over the year, says really good things about them.

The year average of disconnects per mile average shows the variation in the different approaches to self driving (and, presumably, approaches to self driving testing). There are four orders of magnitude difference between Bosch and Waymo (1442 down to 0.18).

And, for that type of dynamic range, a log scale chart is most useful!

Finally, since some of the companies showed some rather significant improvement over the course of the year (or were just amazing all year long), here’s a final chart showing the November disengagement ratio for the top four companies (Bosch and Mercedes were radically worse in disengagements, and I required at least 100 miles of driving in November to count for this list so there’s useful data at these lower disconnect ratios).

Conclusions
This is just one metric of many about self driving (though it is a more available metric due to the reports), but the monthly data (as opposed to the yearly data) shows that GM Cruise is improving very rapidly, and Mercedes has made some very significant improvements over the year (but still has a long distance to go).
Waymo, however, is an order of magnitude ahead of second place here. In 2016, they drove over an order of magnitude more miles than the next closest company (GM Cruise), and are an order of magnitude better on the disconnect ratio than the next closest competitors (BMW, Ford, GM Cruise, Nissan, etc).
In any case, it’s interesting to see that between the best and worst companies in CA, there is a 4 order of magnitude difference in disconnect ratios - that’s kind of insane.
And, if you find yourself betting on winners in self driving? Waymo and GM Cruise look like good bets!
Comments
Comments are handled on my Discourse forum - you'll need to create an account there to post comments.If you've found this post useful, insightful, or informative, why not support me on Ko-fi? And if you'd like to be notified of new posts (I post every two weeks), you can follow my blog via email! Of course, if you like RSS, I support that too.


