
If I haven’t said it before, thermal imagers are cool. They let you see the world in a very different sort of way. This week, I’m reviewing the InfiRay P2 Pro thermal camera. This is a $300 cell phone based sensor, but it comes with a very interesting little thermal macro lens that lets you really get up and close to electronics.

The snap on macro lens is incredibly useful if you’re dealing with anything circuit board related. It gives you a focal distance of about an inch, and allows you to see the heat coming off individual SMT components on a board, in addition to the heat in all your traces (at least for the top layer or two).

Disclosure: This unit was provided free of charge as a review unit to me. All thoughts and opinions on it are my own. I’m reviewing the iOS version.
The P2 Pro
If you’re just looking for the general specs, Infiniray’s website covers the basics. The sensor is a 256x192 pixel imaging array working at 25Hz. The measurement range is listed as -20-550C +/-2C - or, for those of us used to thinking in the other units, about -4F to 1020F, +/- 3.5 degrees. It’s a tiny, light little unit that uses your cell phone’s battery to run it, and the main problem with carrying it around will be losing it, not finding a spot for it in your bag.
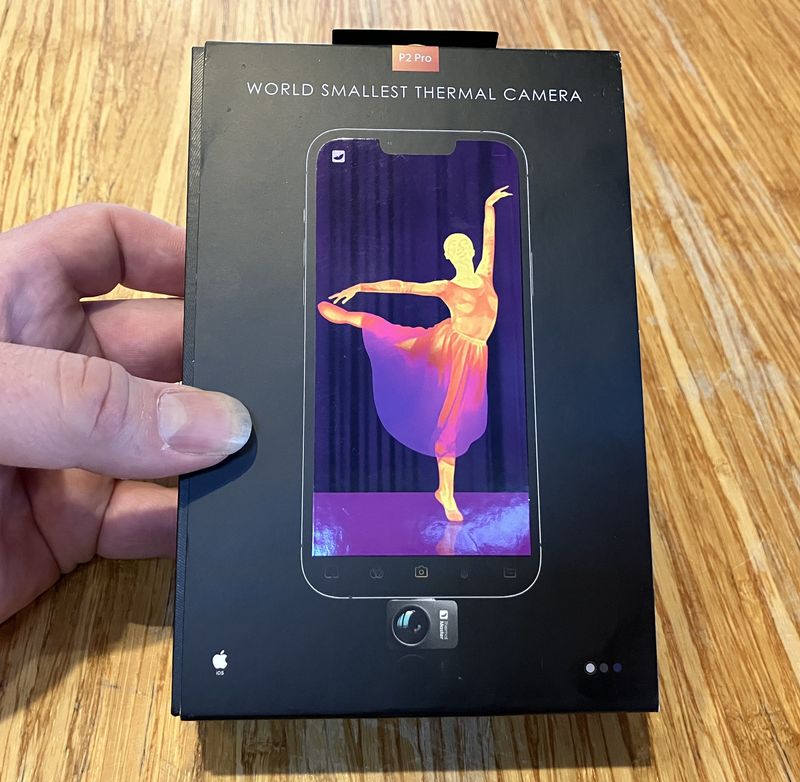
It arrives in a nice looking box, and while I tend to prefer a more “standard recyclable box” style packaging, it’s a good looking box.

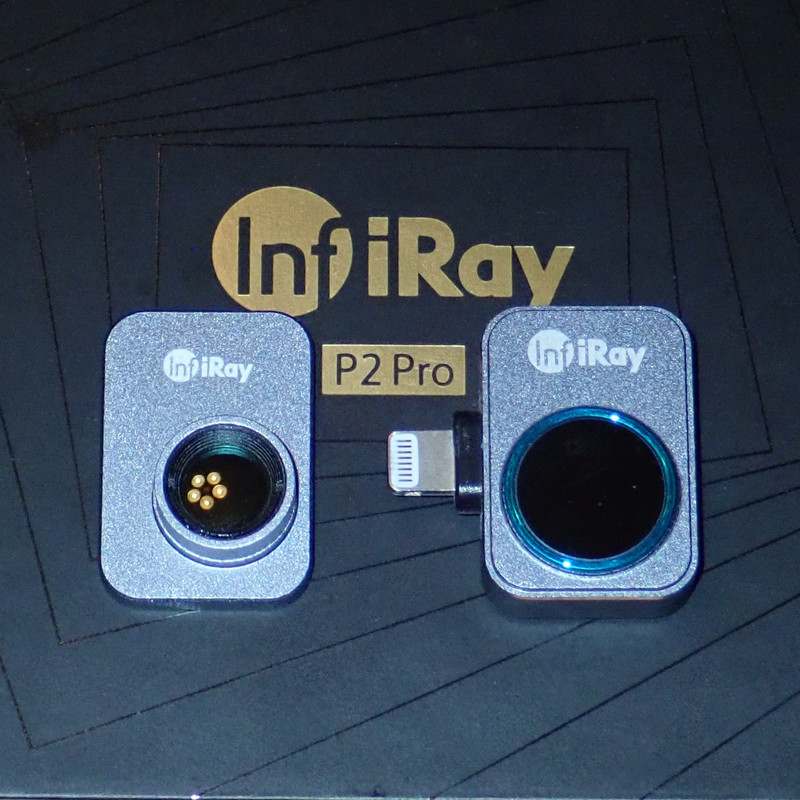
Inside, you get a packet of instructions, and the two parts of the imager, padded well enough that even UPS Ground isn’t going to manage to damage them. On the right, the imager. It’s a Lightning device (again, my version - there’s a USB-C one for Android users as well, and you’ll note that both USB-C and Lightning are reversible connectors - no micro-USB orientation games here). On the left is the magnetic macro lens - which turns this from a pretty standard thermal imager into something very, very interesting for people doing close up electrical work.

Standard desktop hard drive and Raspberry Pi for scale. This really is a tiny little unit!

The included directions suggest you search for “P2 Pro” in your app store, and I’ll suggest that instead you search, at least on iOS, for “Thermal P2.” I’ll cover the software later in rather more detail, though. The instructions could use some going over by a native English speaker, but they get the point across. Don’t point it at the sun, don’t disassemble it, be gentle with your thermal imager.

Flipping the units over, there are no markings on the back. I wouldn’t mind some basic specs or at least a model number on the back. The black bit on the macro lens is a magnet to hold it to the main imager when you’re working up close.

And the macro lens just clips on top when you want to do up close work!

There’s really not much to it, mechanically. All the interface is on your phone - so, next, I’ll take a look at the software.
One thing worth noting: The iOS version does not come with an extension cable. For general purpose use, this isn’t a problem, but if you’re working with small electronics troubleshooting, a Lighting extension cable allows you to mount the imager remotely from your screen - and that’s a nice capability to have. Just pick any cable up, it should work fine.
Thermal P2 Software
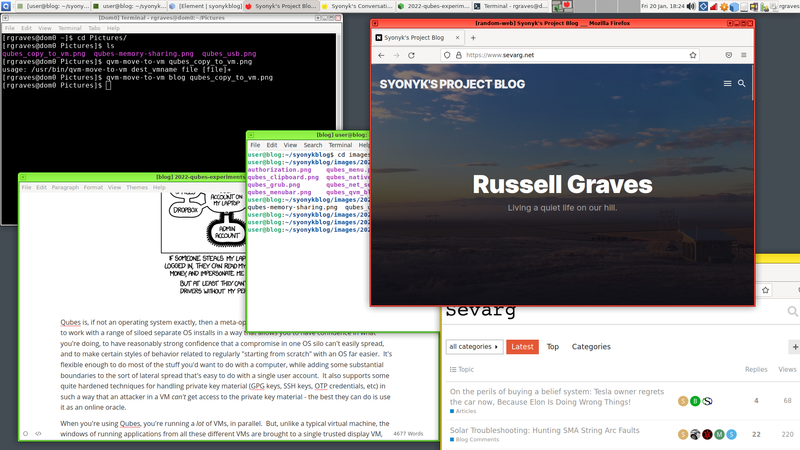
As I mentioned earlier, on iOS, you’re going to look for something called “Thermal P2” - it should look more or less like this. There are a range of other thermal imaging software packages on the App Store for various hardware bits, and none of them are the right one. You want this one. And I’ll mention that the update from a week ago actually fixed a bug I reported while reviewing this unit (related to smaller screen sizes - the iPhone 2020 SE I use is a smaller screen than most of the flagship devices, and the UI layout wasn’t quite right). So, yay for responsive developers!

One of the problems I have with “cell phone based tools” is that you have to keep a phone around that’s compatible with them. I have, among other bits of technology, a Nexus 5X that I keep in the car simply to talk to my OBD-II adapter and chat with car computers about their problems. One thing I very much appreciate about this bit of software is that it works back to iOS 11 or later - which means an iPhone 6 or newer should be able to run it. Keeping an old device around simply to run this software doesn’t seem like it’s going to be a huge cost, and I very much encourage the developers to not change this. Being able to use old, cheap, otherwise mostly useless devices for imaging is useful - and, of course, you can also use the device on a fully modern device if you care to.

Start it up, plug the imager in, and you should see the “basic mode” user interface pop up. I’m using my office compute farm as a target here because it’s close and thermally somewhat interesting. This is a pile of used computers that runs a range of BOINC-type tasks on my solar surplus for large chunks of the year. By default, you’ll also get three temperature marks - center, hottest point, and coldest point.
On the left, you’ve got options for photo or video mode - so if you want to shoot a video of chasing your kids through a field at night in IR, you can absolutely do that! The button in the center takes the photo or video, gallery gets you the expected image gallery (which gives you features you don’t normally get in an image gallery), and palette lets you select from a range of color mappings for images - though I find most of them absurd and only tend to use one of a few settings. The lower left button overlaying the image is a set of options for the current mode. Top right gets you the main application menu for some additional settings. The “Picture in Picture” button gets you exactly what you’d expect (or, if you haven’t given the application camera permissions, a warning in Chinese), and the lower right “iris” looking icon will manually toggle the thermal imager shutter to recalibrate things - though, by default, it does this every so often as it thinks it needs to, and this is normally fine. If you get weird thermal ghosting, tap the shutter image and it should fix the problem. You’ll see the image pause, and hear a faint “click” from the imager as it recalibrates.

The “overlay camera” mode gives you what you’d expect - an overlay from your cell phone’s camera. You can switch to the front facing camera if you want, and the entire box can be dragged around to put it in the least disruptive position, though it likes to snap to edges quite aggressively. The other imager I had would overlay the visual and thermal image on top of each other in varying transparencies, and I don’t have a particular preference - realistically, I think the modern imagers have sufficient resolution that it’s only useful if you need to read some label text to distinguish what you’re seeing. I’ll show off some cityscape photos later that are very much identifiable even at what we’d consider a low resolution by modern camera standards.

Tap the “three boxes and an angled box in a circle” icon and you get into the commonly used image and camera settings. The center “Temperature Display” one is pretty self evident, and simply turns the “center/high/low” temperature points on and off. “Image Settings” gets you brightness and contrast sliders for the IR image, though I’ve found no reason to mess with them.

“Image flip” gives you image rotation and mirroring options for the output. Most of the time the built in accelerometers make the image do the right thing, but this would be handy if you’ve got the camera remote mounted for soldering work or analysis - you can easily flip the image around to show properly on your display screen.

“Variable Correction” gets you into the emissivity calibration settings, which… well, you can read up on that elsewhere if you want. You can set an emissivity value (roughly “How good is a surface at emitting its own heat versus reflecting other heat”), and you can set both ambient temperature and range to help correct for the air influencing the temperature. As I tend to be more interested in “What’s hot relative to other things?” as opposed to absolute values, I generally don’t mess with this on any of my sensors.

Finally, there’s the “Measurement Mode” setting. The high quality setting is only good for objects up to around 120C (250F), and above that you need to set the “wide range” setting to measure up to the maximum temperature (which produces a far lower quality image).

For most “around the house” sort of measurement, high quality is fine, and leads to the best images. But if you’re not sure, or you’re dealing with things you expect to be quite hot, you need to either enable automatic switching (which doesn’t seem to work particularly well), or you need to set the sensor to wide range. If you don’t do this, you get nonsense results.
This is my tractor engine, shortly after shutdown, in the “high quality” mode. You can see the exhaust manifold on the engine, the exhaust pipe flowing around from the left, down and up the stack. The hottest point really shouldn’t be at the bottom of the stack riser, but that’s what shows. However, if you see the exhaust manifold looking “speckled,” that’s the sort of indication you get that the sensor range has been exceeded. There’s no good notification setting I’ve found for reporting that the sensor is out of range, unfortunately - but a weird mottled speckle pattern is that indication.

Changing to the wide range setting, the image is obviously far less detailed - but also now reports the hottest part being at the end of the exhaust manifold, which makes the most sense (it’s not being cooled by the engine block as much in that corner). Notice how the stack temperature is about the same, but the hottest reported temperature is both far higher, and at a different spot. This is really a setting that matters when you’re dealing with hot items, and it’s something that other sensors don’t seem to need. My HTI unit will read full range without any adjustments in mode needed. Not a real problem, just something to be aware of if you’re not sure about the temperature of what you’re measuring.

There are a few options in the settings menu that matter. The most important is the toggle, on the first page, to enable “Professional Thermometry,” which I’ll talk about shortly. Under image settings, you can enable the “automatic shutter” setting (which should be enabled by default). This detects when the sensor is drifting out of calibration and automatically re-calibrates - which you want on, almost certainly. You can also configure a time lapse rate for when you hold the button down.

The “Measurement Setting” menu allows you to decide what temperature units you’d like to work in, and to set an upper/lower alarm temperature, if you want. You should leave “Burn Prevention” on - it will close the shutter to prevent damage to the sensor. I’m not actually sure why that’s even an option in here, really. “Do not destroy thermal imaging sensor!” should be a built in function of the sensor.

Finally, if you turn on the “Professional Thermometry” (if you use that, are you a Professional Thermometer?) setting, you get a slightly revised UI in the main interface, with a few more options over on the side. Now, instead of having automatic measurement points over the whole image, you can add points, lines, and regions that are independently analyzed. For each point, you see the temperature. For each line, it shows the hottest and coldest points on the line. And for each region (“frame”), you get the same - hottest and coldest point. An obvious question should be, “How do you do all this while maintaining the camera in a fixed spot?” - and that’s resolved by doing this in the gallery view, against an already taken image. You don’t have to do it live - and neither do you have to use external software to do the analysis!
You can have up to three points, lines, and frames on an image - if you add more, it simply removes the oldest one and shoves the rest down one number.

In the professional mode, you can also turn on the scale, which shows you the full temperature range of the image, as well as the color progression from coldest to warmest. With the lock icon locked, it’s always going to show full range. But it’s got another neat trick if you unlock that and start playing around!

Unlock the scale and you’ll see two red bars. Drag them up and down, and you can set the temperature ranges you care about! Everything within that range is shown in the proper colors for your currently selected palette, and the rest is shown as a black and white image in the “white hot” mode. If you find that the “scale” icon is greyed out and not working, just pick a different palette and it’ll start behaving as you’d expect. You can show the coldest part of the image, the hottest part, or something in the middle. It certainly serves well to highlight the hottest parts of the image, and it’s a useful enough feature. Again, you can do this analysis after the fact in the gallery mode should you want to take an image now and poke and prod at it later before exporting it.

Tap the Gallery icon to enter the gallery of images captured. Unlike a lot of camera applications, these images are not automatically injected into your photo stream - and there’s a good reason. They’re not actually stored as images - they’re stored as the full array of thermal data such that you can do all your analysis after the fact, should you care to do so. Tap an image, and you’ll see a few options. Along the bottom, “Share” lets you export the image in the usual ways - copy it, save it to your local photo library, print, etc. Once you’ve got it showing what you want, “Save” is the easiest way to get it out into the rest of your phone as an image. “Detail” will show you when it was captured and let you edit the name. “Delete” works as expected, and “Report” will put the image and some metadata into a Word document for later use. I’ve no idea what this is for, but presumably it’s useful to someone.
You’ll probably want to click “Edit,” though. That’s the most fun!

This brings up the full “Professional” interface, and you can proceed to poke and prod your image, change palettes, adjust the temperature scale, and mark it up to your heart’s content before saving the image again! Note that the interface is rotation sensitive - if it’s putting the text and scale in the wrong orientation, just rotate your phone more forcefully and it should get the idea and rotate everything around. Once you’ve got things marked up, you can save your image and export it if desired. When you tap “Save,” you’ll have an option to overwrite the existing image with your new markings, or to save as a new image. In either case, you can later go back and remove your markings, adjust the palette, and generally mess around with it more later. So, instead of doing all the analysis while the camera is facing your target, just snap a thermal image, come back later, and figure out what you need to know!

Palette Options
There are a wide range of palette options you can select, as seems standard for most thermal imagers. I’m only inclined to use a few, because, to me, only a few are actually meaningful in terms of any intuitive sense of temperature. However, as of the time of writing this post, these are the options you have for palettes - and, remember, you can switch them around as you want when editing an existing image. No need to worry about it up front.
White-Hot
The default, and one of the more useful image modes, is “White-hot.” The brighter the pixel, the hotter the image! Slightly annoyingly, you can’t enable the scale mode for this or the next one - it’s only available in the rest of the colorful modes.

Black-Hot
The opposite of white-hot, black-hot indicates hotter pixels with darker colors. If you’re looking for something colder than the rest, this might be a useful mode.

Rainbow
Mapping heat onto the colors of the rainbow, with “red” being hottest and “violet” being coldest gets you this view. It’s the default on most thermal imagers, so will probably look familiar. It does offer a lot of differentiation between fairly minor temperature changes. You’ll typically see the sky looking quite cold - though I’m a bit fuzzy as to why there’s the outline of the coldest pixels around the church. Quirk of the instrument, I suppose.

Iron-Red
My default mode for thermal imagers is “iron-red,” because it correlates (more or less) to how a bar of iron looks as it heats up. Black is coldest, white is hottest, and the shades of red through orange and yellow indicate the rising heat. It makes the most sense to me.

Aurora
Another option is Aurora. Again, red is hottest, and it goes through the blues and greens. Most of the modes from here on out are just “neat color patterns,” as far as I’m concerned, and not of great practical use. But most imagers include plenty of color mappings - so feel free to find a mapping you like!

Jungle
Jungle is another mapping option.

Golden-Red
Golden Red is similar to the Iron-red mode I typically use, but it adds more blue at the bottom end for a slightly higher contrast going from cold to hot.

Medical
I’m going to assume this mapping makes sense to someone in the medical field? Perhaps it’s a standard calibration they use? Otherwise I’ve no idea what to make of it.

Dim Light
Target Acquired. Closing in… This is a “classic night vision” sort of mode. It’s like white-hot, but going through the greens instead. If you’re playing night tag or something, this is probably the mode you want to use.

Gold
The same concept, running through the golden yellows.

Red-Hot
The Red-hot mode is almost identical to white-hot - except, the very top of the temperature scale is red. It’s useful for highlighting the hottest thing in the image quickly.

City
This recently added mode sure is colorful… though it seems to wash out a lot of the temperature gradiants.

Anyway, pick what works for you. Once you find one you like, you’ll probably stick with it.
The Macro Lens
So far, nothing I’ve talked about is unique to this thermal imager. The software is decent and does the job, and the imager obviously works. What sets the P2 Pro apart is the macro lens it ships with. With this lens on, the focal distance is only about an inch - but you get amazing close up detail of circuit boards or other things you want great thermal detail on.
Without the macro lens, you can get a general picture of the shape of heat on something like a small board computer (this is a Rock 5B - promising hardware, software leaves something to be desired currently). As you get closer, things get blurry, and you just can’t really identify the hot parts more than “in general.” It’s useful, but… we can do better.

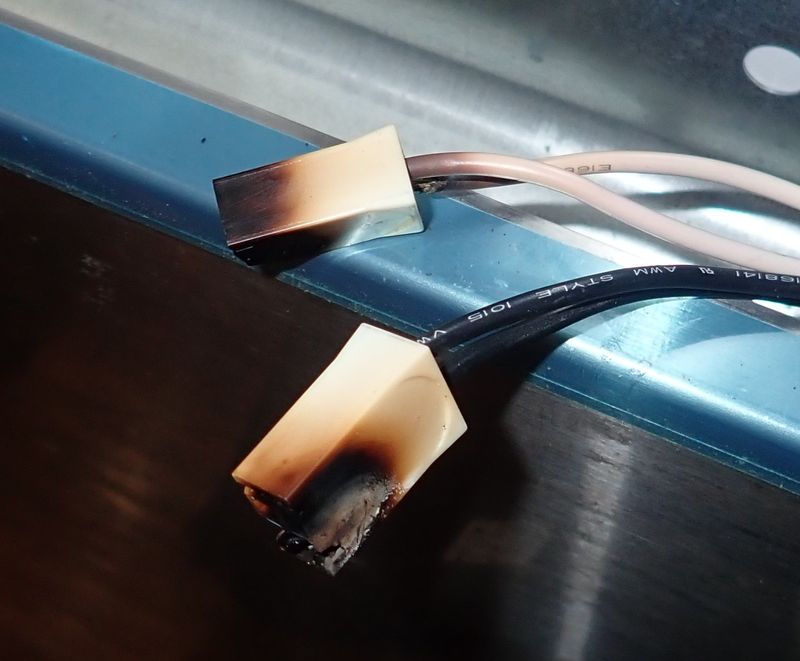
Add the lens, get about an inch away (an extension cable is very useful for doing this), and… you can see the heat out of each individual resistor and surface mount component on the board. Interestingly, you can read the markings on some of the components - the markings are different enough in thermal emissivity that they show up. Guess what’s handling power in this image?

Less thermal, more visual, you can see the feature sizes here - these aren’t large SMT parts.

Beyond just parts, you have enough resolution to see the heat in individual traces coming off chips. A combination of the resistance from current and simple thermal dissipation will show up. A bit of wisdom from someone I greatly respect is, “Every beginning board designer makes the same mistake of forgetting that copper isn’t a superconductor.” With this sort of view, you can identify which trace in a bunch of traces is running hotter than the rest - and that’s a properly useful sort of capability!

You get high resolution component and trace level thermal detail on a board - and at this point, you either have no idea why anyone cares, or you’re wondering how to order one of these gizmos.

Of course, not everything is quite as helpful. The heat spreader on the chip is, while visually matte, very thermally reflective - so you can take thermal selfies of the sensor! I’m fairly certain the square inside is the shape of the actual sensor once you pull the gizmo apart.

Uses of a Thermal Imager
What sort of things can you use a thermal imager for? Any time you want to see heat, of course! The modern sensors are sensitive enough to detect even fairly small, few-degree differences of temperature, and with the auto-ranging colors they’ll show up nicely (though there are times I wish I could lock the scale to a certain range).
For trying to improve the thermal insulation on a house, this sort of sight is absolutely priceless. This is a corner of one of the rooms in our house - it’s an outside wall, and on a fairly mild day you can see quite clearly the thermal bridging of the studs on the drywall. According to the sensor, there’s less than three degrees F between the hottest and coldest points in the image, but the pattern is absolutely visible and what’s expected (this image being when it’s cooler out than in, right now it’s rather the other way).

You can see the thermal aftereffects of a person passing around. Footprints show up on the ground, and for this image, I set a bottle of cold water on the table for a bit, and pressed my hand against the table - both show up quite clearly as lingering thermal images.

Do you spend some of your time arguing with older engines? Being able to see heat means you can solve what used to be rather annoying problems far more easily. Does your radiator have any clogged passages, or is it flowing freely? If you look your radiator when the coolant has been flowing for a while, you can easily see if the radiator is evenly hot (as my tractor’s radiator is here), or if there are sections that aren’t as warm (indicating blockages).

Similarly, there are a range of ways to detect a misfire or dead cylinder in an engine - but you can also look at the engine thermally and see which spark plug is cooler than the rest, or which exhaust port is running cooler. It’s handy for a range of things.

Even with a lower resolution sensor, there’s still more than enough resolution to do very useful things!

Final Thoughts
When I did my HTI HT-19 review, I talked about the perks of standalone devices being long lived, and not requiring a particular phone. I still think that’s valuable for a tool - but in the past few months I’ve been playing with this imager, I really do enjoy the fact that I have the imager and software to poke with things all in one device, and it’s pretty darn convenient to be able to send images out to people without having to do a USB cable based transfer. I remain concerned about the longevity of this sort of device as Apple is moving away from Lightning connections (Android will probably keep USB-C around for longer), but “keeping an old phone around to run something like this” is already something I’m doing with the car interfaces. It’s a bit more tech to keep around, but it’s not an unsolvable problem, either.
I’ve not done a lot of side by side comparison between the HTI-19 and the P2, because I don’t think it matters that much. Any thermal imager is so dramatically more useful than none that I don’t think the details matter. But the P2 Pro has a far higher refresh rate than the HTI-19, and it produces a more detailed image in the deal. Left is the HT-19, right is the P2 Pro.

As long as you remember about the wide range settings for high temperature items, it’s a well behaved, flexible unit. And that whole macro lens for super tight thermal imaging of PCBs is just awesome.
My general recommendation hasn’t changed - you don’t need your own thermal imager. You need access to a thermal imager, of some variety that you’re able to use, in your “social tool sharing circle.” If you don’t have one of those, well… get one. But right now, as far as I’m concerned, I was wrong about standalone imagers versus phone-based ones. The phone based ones are quite useful, and in the past few months, when I’ve been curious about the thermal profile of something, I simply can’t deny that I’ve gone to the P2 Pro. It’s a properly impressive tool, and you should consider one!
Buying One
If you’d like to pick one up, you can buy them from XInfrared, or, if you prefer Amazon, you can get a discount with the code “russell21” - put it in during checkout in the “gift card, voucher, or promotional code” field.
Comments
Comments are handled on my Discourse forum - you'll need to create an account there to post comments.If you've found this post useful, insightful, or informative, why not support me on Ko-fi? And if you'd like to be notified of new posts (I post every two weeks), you can follow my blog via email! Of course, if you like RSS, I support that too.